

 English
 français
 Deutsch
 español
 العربية
 中文
中文
In industrial production and commercial operations, the stable operation of power systems is the core foundation for ensuring equipment performance and improving production efficiency. However, power quality issues such as voltage sags, harmonic pollution, and grounding faults often lead to abnormal equipment shutdowns, fluctuations in product quality, and even safety hazards. As a key means to identify and solve such problems, the power quality survey’s systematicness and professionalism directly determine the efficiency and effectiveness of troubleshooting. Combining industry standards and practical experience, this article details the entire process of power quality surveys, providing an actionable framework for engineering and technical personnel.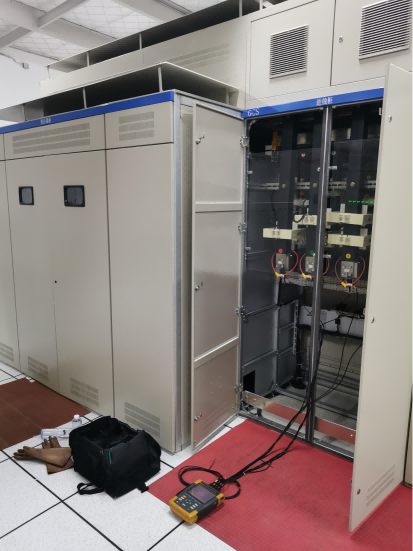
The hazards of power quality issues are concealed and cumulative. In the short term, they may manifest as equipment errors and data transmission interruptions; in the long term, they can accelerate the aging of key equipment such as motors and transformers, increasing maintenance costs and shutdown risks. For example, a manufacturing enterprise suffered a production line PLC system restart due to a grid voltage sag, resulting in a loss of hundreds of thousands of yuan from a single shutdown. A data center experienced abnormal current due to poor neutral grounding, causing hardware damage to multiple servers.
A power quality survey is not simply "fault detection" but a systematic assessment conducted in an organized, phased manner to achieve three core goals:
1. Root Cause Localization: Distinguish whether the problem originates from the grid side (e.g., power supply bureau capacitor switching) or the user side (e.g., start-stop of high-power equipment).
2. Impact Quantification: Use data records to clarify key parameters such as voltage fluctuation amplitude and harmonic content, and determine whether they exceed the equipment tolerance threshold.
3. Solution Formulation: Design targeted rectification measures based on survey results, such as installing UPS, filter devices, or optimizing grounding systems.
International standards provide a key basis for surveys, among which IEC 61000-4-30 Class A is the core specification for power quality measurement. It requires equipment to have the ability to accurately capture issues such as voltage sags, harmonics, and flicker. American IEEE standards are also gradually aligning with this specification; for instance, IEEE 519:2014 has adopted the harmonic measurement method of IEC 61000-4-7, further unifying industry technical standards.“
The accuracy of a power quality survey first depends on the rational selection of tools. The functional requirements for tools vary significantly across different scenarios, and core equipment can be divided into two categories: "portable" and "fixed," with auxiliary tools used to supplement detection blind spots.
|
Equipment Type |
Representative Products (e.g., Dranetz) |
Installation Method |
Core Advantages |
Applicable Scenarios |
|
Portable Monitors |
HDPQ Series |
Temporarily installed, removed after survey completion |
1. Supports Wi-Fi/Bluetooth remote control, reducing personnel exposure to high-risk environments;2. Equipped with clamp-on/Rogowski coil current probes, suitable for different wire diameters;3. Local screen + Dran-View 7 software analysis for real-time data visualization |
1. Single-point equipment fault diagnosis (e.g., frequent tripping of a motor);2. Short-term baseline surveys (e.g., one-week grid quality assessment);3. Scenarios with high mobility needs (e.g., rotating detection across multiple workshops) |
|
Fixed Monitors |
Dranetz Fixed Systems |
Permanently installed in distribution cabinets/switchgear |
1. Uses screw terminal wiring for strong stability, suitable for long-term operation;2. Accesses servers via Ethernet/fiber optics to enable centralized monitoring of multiple points;3. Automatically records trend data and events, supporting real-time fault alarms |
1. Long-term monitoring of key nodes (e.g., Point of Common Coupling (PCC), UPS output terminals);2. Construction of a full-plant power quality monitoring network;3. Scenarios with high reliability requirements (e.g., data centers, hospital ICUs) |
In addition to core monitors, the following tools can enhance the comprehensiveness of surveys:
· Infrared Thermal Imagers: Detect abnormal heating of loose connections and overloaded cables in distribution cabinets to identify potential fault points in advance.
· Ground Resistance Testers: Measure the impedance of grounding systems to troubleshoot abnormal currents caused by poor grounding.
· Insulation Testers: Evaluate the insulation performance of cables and motor windings to determine if there is a risk of leakage.
· Video/Audio Recorders: Record abnormal noises (e.g., excessive humming from transformers) and indicator light status during equipment operation to assist in fault analysis.
Note: All tools must be calibrated regularly to meet the accuracy requirements of IEC 61000-4-30 Class A, avoiding data misjudgment due to equipment errors.
A power quality survey must follow a closed-loop process of "planning - inspection - monitoring - analysis - rectification - verification." Each phase has clear goals and operational key points, and none can be omitted.
Planning is the prerequisite for a successful survey and should be carried out around the "5W" principle (What/Where/When/How/Why):
1. Define Survey Objectives (What & Why)
2. · For "fault diagnosis," clarify fault phenomena (e.g., equipment tripping, screen flickering) and the model and location of affected equipment.
· For "baseline surveys," determine evaluation indicators (e.g., voltage deviation, harmonic content) and compare them with industry standards (e.g., IEEE 519 harmonic limits).
3. Determine Monitoring Points (Where)
4. · Single-point faults: Prioritize monitoring the power access terminal of the faulty equipment, then trace back to the PCC (Point of Common Coupling) to identify the source of the problem.
· Full-plant issues: Start from the PCC and cover all feeder circuits and key loads (e.g., UPS, large motors) downward to form a "top-down" monitoring network.
· Focus on the PCC: As the boundary between the user and the grid, monitoring data at the PCC can clarify responsibility attribution (e.g., grid-side voltage sags vs. user-side harmonic injection).
5. Set Monitoring Cycles (When)
6. · Cover at least one "business cycle": For example, a three-shift factory requires 72 hours of monitoring, and a shopping mall with different weekly operation modes requires one week of monitoring.
· Align with fault patterns: If problems only occur at 8 a.m. and 6 p.m., focus on capturing equipment start-stop (e.g., air compressors, elevators) or grid capacitor switching periods.
7. Collect Basic Information (How)
8. · Retrieve plant electrical drawings to confirm transformer capacity, wiring methods, and grounding system types.
· Interview equipment operators to record fault occurrence times, durations, and accompanying phenomena (e.g., "Every time the welding machine is started, the computer restarts").
· Document recent changes: Such as new equipment additions, line modifications, or grid upgrades, which may be triggers for problems.
On-site inspection is often overlooked, but many power quality issues stem from basic electrical defects. Inspection should be conducted in two steps: "outdoor" and "indoor":
1. Outdoor Inspection (Grid Side)
2. · Check the type of power supply lines (e.g., overhead lines are vulnerable to lightning strikes, and underground cables are easily damaged by construction).
· Observe the location and operating status of the power supply bureau’s capacitor compensation devices to determine if there are voltage fluctuations caused by frequent switching.
· Pay attention to nearby interference sources: For example, intermediate frequency furnaces and radio frequency equipment in nearby factories may cause interference through grid coupling.
3. Indoor Inspection (User Side)
4. · Visual inspection: Check if distribution cabinet doors are loose, if cable insulation layers are damaged, and if terminals have signs of ablation.
· Infrared detection: Use a thermal imager to scan circuit breakers and contactors to identify hot spots (e.g., loose connections with temperatures exceeding the ambient temperature by 30°C).
· Focus on wiring issues: According to industry experience, loose connections are the most common cause, which may lead to voltage dips and pulse interference (see Table 1).
· Verify the grounding system: Check if the connection between the neutral wire and ground wire complies with regulations to avoid issues such as "neutral-to-ground reversal" and "high-impedance grounding."
Table 1: Common Wiring Problems and Their Impacts
|
Problem Type |
Typical Impacts |
|
Loose Connections |
Voltage pulses, local overheating, intermittent equipment power failures |
|
Faulty (Hot) Circuit Breakers |
Voltage dips, frequent tripping, failure of circuit protection |
|
Incorrect Neutral-to-Ground Connections |
Abnormal grounding currents, live equipment enclosures |
|
Open Neutral in Polyphase Circuits |
Severe phase voltage fluctuations (e.g., 220V rising to 380V), burning of single-phase equipment |
Special attention must be paid to safety regulations: All inspections must comply with NFPA 70E (National Electrical Code), and operators must wear personal protective equipment (PPE) such as insulated gloves and goggles. Live disassembly/assembly of wiring is strictly prohibited.
The monitoring phase requires simultaneous recording of "voltage + current." Measuring only voltage can identify problems, but combining it with current allows locating the root cause (e.g., increased current accompanied by voltage drop indicates the problem originates from downstream loads). The operation is divided into three steps:
1. Mode Setting (Scope Mode)
2. · Enable the oscilloscope mode to observe whether voltage and current waveforms are distorted (e.g., "clipping" or "glitches" caused by harmonics) and determine if there is interference from nonlinear loads (e.g., frequency converters, LED lights).
3. Time Interval Recording
4. · Set the sampling interval (e.g., once per minute) to record background data (e.g., voltage RMS value, power factor) and capture slow changes (e.g., grid voltage drift, gradual load increase).
5. Event Threshold Triggering
6. · Set thresholds based on equipment tolerance (e.g., voltage sag ≤ 80% of rated value, harmonic content > 5%) to record only key events and avoid data redundancy ("No need to capture the entire ocean when only target fish are needed").
· Review data regularly and adjust thresholds: For example, if the initial threshold is set to "voltage sag > 10%" and too many irrelevant events are recorded, it can be increased to " > 15%".
Data analysis should avoid "data stacking"; the core is to "correlate fault phenomena with monitoring data," proceeding in four steps:
1. Filter Key Events
2. · Extract data consistent with fault times (e.g., "Equipment tripped at 10:00, and monitoring showed a voltage sag to 70% at 9:59, lasting 0.5 seconds").
· Exclude irrelevant events (e.g., "Voltage fluctuation of 0.5% lasting 1 second, which did not affect equipment operation").
3. Quantify Problem Severity
4. · Compare with standard limits: For example, if the 3rd harmonic content is measured at 8%, exceeding the 5% limit specified in IEEE 519, it is judged as "severe harmonic pollution."
· Analyze event trends: For example, if 12 voltage sags occur within a week, 8 of which are concentrated during morning shift equipment startup, it indicates the problem is related to user-side loads.
5. Integrate Inspection Results
6. · If "voltage pulses" are detected and loose terminals are found during inspection, a preliminary judgment of "pulse interference caused by loose connections" can be made.
· If harmonic content at the PCC is high but there are no high-power nonlinear loads on the user side, contact the power supply bureau to investigate grid-side issues.
7. Locate the Root Cause
8. · Downstream problems: Increased current → voltage drop (e.g., voltage sag caused by motor startup).
· Upstream problems: Voltage changes first → current follows (e.g., load current fluctuations caused by grid voltage drift).
· Grounding problems: Abnormal neutral current accompanied by live equipment enclosures, requiring inspection of grounding impedance.
Rectification should avoid "blind equipment installation" and instead develop solutions based on the root cause. Common measures are as follows:
|
Problem Type |
Rectification Solutions |
Applicable Scenarios |
|
Voltage Sags/Interruptions |
Install UPS (backup type for single machines, online type for critical loads) and voltage regulators |
Data centers, PLC control systems, medical equipment |
|
Harmonic Pollution |
Install active power filters (APF) and passive filter cabinets |
Scenarios with concentrated nonlinear loads such as frequency converters, welding machines, and LED screens |
|
Poor Grounding |
Replace ground electrodes, reduce grounding impedance, and correct neutral-to-ground connections |
Live equipment enclosures, abnormal neutral current |
|
Loose Connections/Wiring Defects |
Re-tighten terminals, replace aging cables, and repair damaged insulation layers |
Intermittent power failures, local overheating |
Note: Rectification solutions must be designed by professional electrical engineers to avoid "over-protection" (e.g., installing UPS for ordinary lighting circuits) or "insufficient protection" (e.g., using passive filters to handle high-order harmonics).
After rectification, repeat monitoring (with the same cycle as the initial survey) to verify effectiveness:
1. Compare data before and after rectification: For example, if harmonic content decreases from 8% to 3% and the number of voltage sags drops from 12
times/week to 0, the solution is effective.
2. Long-term tracking: Fixed monitoring systems need to record data continuously to ensure no recurrence of problems.
3. Document archiving: Organize and file survey reports, monitoring data, and rectification plans to provide references for subsequent maintenance.
1. Reasonableness Check: Data must comply with physical laws (e.g., "If voltage rises but current drops, check if wiring is reversed"); contradictory data cannot be forced to be explained.
2. Tool Awareness: Clarify equipment limits (e.g., clamp meter range, monitor harmonic measurement range) to avoid errors caused by over-range use.
3. Check Obvious Problems First: Start with simple causes such as loose connections and wiring errors before troubleshooting complex issues (e.g., grid harmonics).
4. Avoid Over-Analysis: Focus on "key events" affecting equipment operation; there is no need to dwell on minor fluctuations (e.g., voltage ±0.2%).
5. Safety First: All operations must be performed with power off or under insulation protection; live plugging/unplugging of monitor wiring is strictly prohibited.
A power quality survey is a work that combines "technology + experience." Its value lies not only in solving existing problems but also in establishing a "power health file" through baseline data to achieve a shift from "passive repair" to "proactive prevention." For example, an automobile factory discovered through long-term monitoring that the transformer load rate was continuously increasing and expanded its capacity in a timely manner, avoiding shutdown risks during peak summer hours.
With the development of smart grid technology, the combination of fixed monitoring systems and cloud platforms will become a trend. Through real-time data transmission and AI anomaly identification, fault response time can be further shortened. However, regardless of technological upgrades, "systematic planning, accurate monitoring, and rational analysis" remain the core logic of power quality surveys and the cornerstone of ensuring the stable operation of power systems.


 IPv6 network supported