

 English
 français
 Deutsch
 español
 العربية
 中文
中文
A small entity of electrical network known as Microgrid provides secure and reliable energy supply to the critical loads of communities. It also provides a sustainable and self dependent energy supply to communities in remote area where there is no access or facility for main grid power system. MG should be capable of operating either in on-gird or off-grid mode.
MG incorporates several DG sources like; RE, conventional power units, and various types of energy storage options. DG in MG provides several benefits such as; low carbon emission of energy supply, improved efficiency and reliability of energy supply, reduction of power losses in distribution network, and defers enhancement of distribution network infrastructure facility etc. Despite of benefits, DG also creates various PQ issues like; power flow variation which causes voltage and frequency deviations, unbalance voltage and current, poor power factor, harmonic distortions, voltage flicker, voltage sag / swell etc. in the MG distribution network .
PQ analysis of MG is essential to quantify the level of PQ issues, in order to develop a real MG model with improved PQ conditions through optimum control measures. Several studies and analysis were carried out by researchers over the PQ issues in MG power network at various conditions. THD analysis was performed through simulation in a typical Photo Voltaic (PV) integrated low voltage distribution network at various conditions. THD voltage and current levels were found high in the following conditions; penetration of PV at higher level, far end feeder, low load, and load operates at leading power factor.
PQ issues were analysed in a typical MG power system at various level of RE penetrations and weather conditions through Matlab software simulation. The level of PQ issues was found high, at 66.6%, and 99.9% of RE penetration as compared to 33.3% level. THD analysis was done while integrating PV with linear and non-linear load. At higher PV penetration level with linear load, THD was found high. At 10% of PV penetration with non-linear load (with respect to linear load), THD was around 4% whereas at 15% of PV penetration with non-linear, THD level was found above standard limit around 5.06%. In addition to THD analysis, three PQ indices were applied to evaluate level of power distortion, wave form distortion, and unbalance in the system network. Similarly, in [8] analysed at above 50% of PV penetration, voltage THD level exceeds above standard level, also found that reduction of voltage THD at worst node when penetrating more PV nearby substation as well as with more loops in highly meshed network.
In this study, in addition to THD analysis other PQ factors such as; power variation, voltage variation, unbalance voltage level also have been analysed in a typical MG power system model through software simulation. Development of MG model and impact analysis has been carried out in PSS-Sincal software environment . The output results from this study will aid in developing a real MG model with improved PQ conditions for communities in future. The section II defines the details of MG model and types of analysis, section III explains the analysis results and discussion, and the conclusion of this study and future research work is given in section IV.
A. MG Power System Model
B. Power Flow Analysis
C. Harmonic Analysis
In this section overall simulation results, given in Table 4 and Table. 5 are discussed in detail.
A. Power Variation
Solar disturbance due to the cloud effect can be considered as one of the main reason for power intermittency in PV output. PV power intermittency can be considered in different time scales like; in “second” level causes voltage flicker and in “minute” level affects the regulation of power generation reserve in power system [14]. A typical solar disturbance for each PV (100 KW) with total installed capacity of around 1 MW, connected at LV (415 V) bus node N7 has been considered for this analysis. During this period of solar disturbance from 11 hours to 11:40 hours, each PV output power variation was observed from minimum 0 KW to maximum 73 KW, as shown in Figure 4.
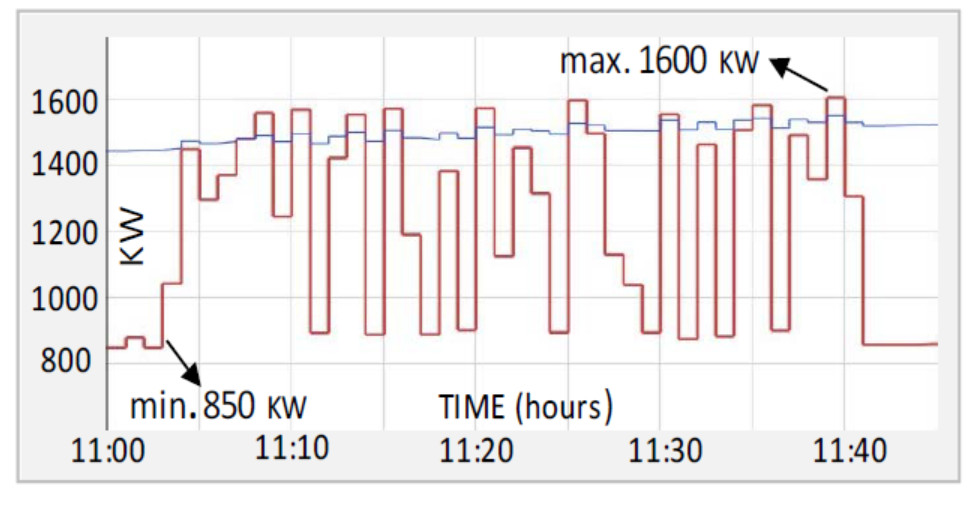
According to daily load profile, an active power and reactive power flow from supply sources (Grid / Diesel generator) are shown in Figure 5. Due to this cumulative effect of power variation from all ten PV units, corresponding power flow variation from grid supply source and diesel generator unit were observed during on-grid and off-grid mode of operation. As shown in Figure 6, power variation was observed from minimum 850 KW to maximum 1600 KW in grid side as well as from diesel generator. This significant power variation creates a situation for an urgent need of power generation reserve and regulation from grid source during on grid mode of MG operation. Similarly, output power variation of solar PV creates a situation for frequent ramp up and ramp down of power requirement from diesel generator, which will lead to increase in wear and tear effect of conventional power unit components, maintenance cost, and thereby reducing the efficiency of diesel generator.
TABLE I. RESULTS OF POWER AND VOLTAGE VARIATION
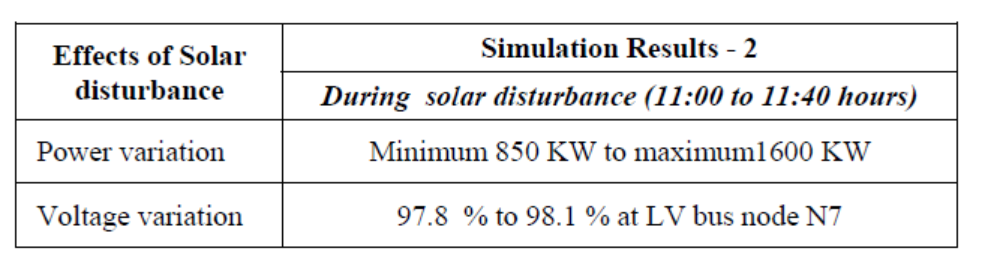
TABLE II. RESULTS OF THD AND UNBALANCE VOLTAGE LEVEL
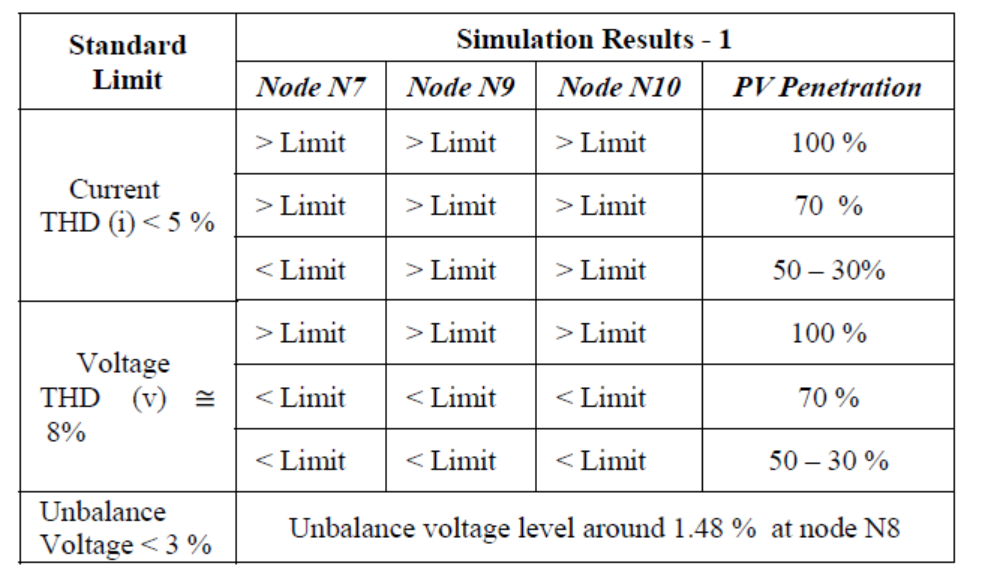
FIGURE I. PV OUTPUT POWER VARIATION
FIGURE II. POWER FLOW VARIATION (GRID / DG)
FIGURE III. POWER VARIATION (GRID / DG)
B. Voltage Variation
Variation of output active power disturbs the flow of reactive power causing local variation in voltage level at LV bus node N7. During solar disturbance, a small voltage variation at LV bus node N7 was observed from minimum 97.8 % to maximum 98.1% as shown in Figure 7.
FIGURE IX. VOLTAGE VARIATION AT LV BUS NODE N7
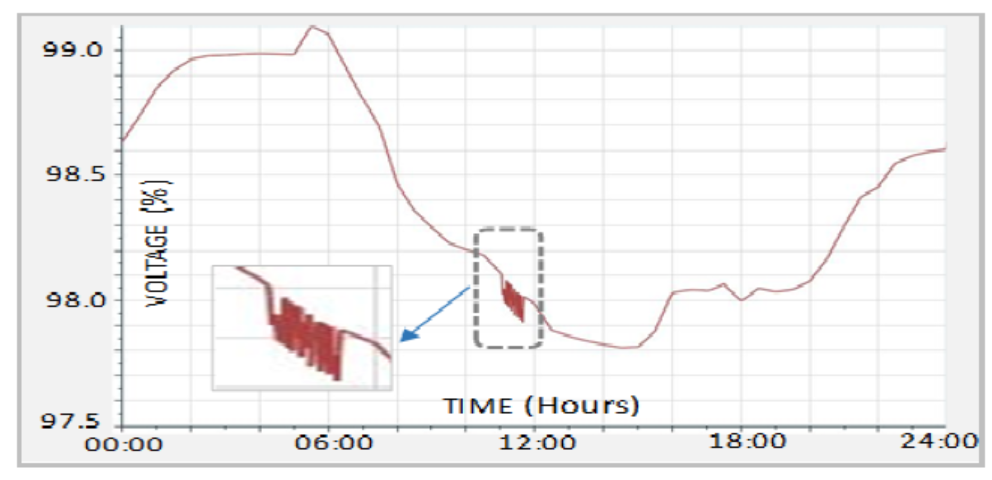
However in case of large level PV integration in a weak network or at peak load with low voltage condition, this voltage variation may reach in a significant level and can affect any sensitive loads connected to that particular bus node.
C. Harmonic Distortion
Voltage and current THD in MG network were analysed with 30%, 50%, 70%, and 100% of PV penetration in reference to the connected total linear load at LV bus node N7, non-linear load at LV bus node N9, and composite load (linear non-linear) at LV bus node N10 respectively. As per the AS4777-2005 standard [15], current THD of inverter up to 50th harmonic order should be less than 5% and compatibility levels of voltage THD as per AS/NZS 61000 [16] should be around 8%.
Both current and voltage THD level exceeds the standard limit for 100% PV penetration at LV bus node N7 as shown in Figure 8. For 70% of PV penetration level, voltage THD value was within the standard limit, whereas the current THD value exceeds the standard limit. Both the current and voltage THD level were well below the standard limit for 50% and 30% of PV penetration level. From the above results, it is clear that the current and voltage THD gets higher as the level of PV penetration increases. This is due to the cumulative effect of harmonic current injection from PV inverters during higher level of PV generation with reference to full load current of linear load at bus node N7.
As per the THD results at bus node N9 shown in Figure 9, current THD values for all the PV penetration levels were significantly high as compared to bus node N7 and also found to be above the standard limit. In 100% of PV penetration level, voltage THD were observed just above standard limit (8.1%) and within the standard limit for other penetration levels. This is due to the effect of only non-linear load (class-A and class-D equipment) connected at bus node N9.
THD results at bus node N10 as shown in Figure 10, clearly indicated that the current THD values were high and above standard limit for all levels of PV penetration (100%, 70%, 50% and 30%) except 20%. Voltage THD values were found to be below the standard limit for all other penetration levels except 100%. Voltage and current THD values at bus node N9 were low as compared to their counterparts at bus node N10. This is due to the effect of composite load where the linear and non-linear loads are distributed in equal (50%) proportion at bus node N10. In this study, harmonic filter (passive or active) was not taken into account in the MG network. Only typical current harmonic data for each PV inverter and non-linear load was considered for this THD analysis study.
Based on the results from Figure 8, Figure 9, and Figure 10, it is clear that the THD reaches in significant level in case of higher level of PV penetration, and amount of non-linear load present in the MG network. This high. level of THD can cause power losses, overheating of conductors, transformers, capacitor banks, motors or generators, and excessive current in neutral line etc. [11] in MG network.
D. Voltage Unbalance
In this study, unbalance voltage level was estimated with typical uneven distribution of single phase loads and single phase PV generators at LV bus node N8. As per the standard AS/NZS 61000.2 [16], compatibility level of unbalance voltage limit in LV network should be less than 3%. At bus node N8, single phase solar PV and single phase loads were distributed in each phase as follows; 10 KW solar PV and 300 KVA load in phase-A, 100 KW PV and 100 KVA load in phase-B, 200 KW PV and 10 KVA load in phase-C respectively. According to typical daily load profile, each phase voltage level at bus node N8 are shown in Figure 11. As per the daily voltage profile, it was observed that during peak load period (12:30 hrs), the voltage level difference between phase-A and phase-B, C was more compared to that of low demand period (05:30 hrs). As shown in Figure 12 that the Voltage level in phase-A was low around 96.2% (399 V), whereas in phase-C was around 99.4 % (413 V). Through this analysis that the unbalance voltage level at bus node N8 was estimated and found within standard AS/NZS 61000.2 [16] limit of around 1.48%. However, this value may vary according to load condition as per voltage profile shown in Figure 11 and also it can increase further above the standard limit in case of any large LV distribution network with the uneven impedance level, uneven distribution of single phase loads and PV generation in LV network etc. This excessive unbalance voltage can have a significant impact on de-rating of the induction motor with increased heating and losses, increased thermal stress for variable speed drive (VSD) electronic components with the addition of triplen harmonic current etc. [12].

This study highlights the critical Power Quality (PQ) issues in Microgrid (MG) systems, including power and voltage variations, Total Harmonic Distortion (THD), and voltage unbalance, caused primarily by the integration of Renewable Energy (RE) sources, Power Electronics (PE) converters, and nonlinear loads. Simulation results reveal that higher PV penetration levels significantly increase THD and voltage unbalance, which can adversely affect the efficiency and reliability of MG systems. Power fluctuations due to the intermittent nature of solar PV require improved regulation, while voltage unbalance caused by uneven load distribution impacts sensitive equipment and increases operational inefficiencies.
With a focus on integrating Active Harmonic Filter, YT Electric’s advanced PQ solutions empower MG operators to meet the challenges of modern energy systems, ensuring reliable, efficient, and sustainable energy delivery. Future efforts can integrate energy storage technologies and optimize control strategies to further enhance PQ and ensure the seamless operation of MGs in diverse scenarios. YT Electric stands as a reliable partner for enabling smarter and more resilient energy systems.


 IPv6 network supported