

 English
 français
 Deutsch
 español
 العربية
 中文
中文
1. Introduction
In light of high energy usage, environmental pollution, and rising fossil fuel prices, current dependence on internal combustion engine (ICE) technology employed in vehicles should be reduced, and the widespread use of electric vehicles (EVs) as the transportation of choice in 20 to 30 years' time should be increased. It is estimated that EV vehicle penetration will increase gradually, with 35% projected in 2020 and reaching 50% by 2024 [1-2].
The general effect on distribution systems caused by the spread of EVs will be a substantial load increase and a large increment of system voltage and harmonic distortion. Another issue that should be considered is the coincidence between the charging start time and the eventual evening load peak period, which varies with customer and country. For charging, EV batteries need DC current, so the grid AC current will be converted to DC by the battery charger. The charger is basically the rectifier/inverter with a controller integrated with a protection circuit. This is where the concern rises because the inverter/rectifier is known as a harmonic source. So one of the concerns with electric vehicle charging is the harmonic contamination to the electrical grid.
There is no agreement, however, on how much the total harmonic distortion (THD) can be released to the network during charging. In one of the published reports, total current harmonic distortion (THDi) is reported between 2.36% to 5.26% at the beginning of charging and reaching up to 28% at the end of charging. However, total voltage harmonic distortion (THDv) is claimed only to range between 1 and 2% with a power factor close to unity. For commercial chargers, THDi from measurement recording values are between 60% to 70% [1,3-4].
The concern of the engineers and researchers is when a large number of EVs are charging simultaneously to the power system grid. What is the sum of THD when EV multiplies in numbers? Many believe that THD will increase with the number of vehicles. It is, however, difficult to find a report that discusses this issue. Moreover, the values indicated in the previous paragraph were reported [3-4] more than 10 years ago, so the values do not represent the actual amount of harmonic generated from state-of-the-art charger technologies that are used in modern electric vehicles.
The study reported in this paper tries to investigate the harmonic distortion from a single EV and a group of EVs. The measurement was performed on an older type of EV and two modern types of EVs. The results of the study are useful in understanding the harmonic distortion contribution from EVs connected to the grid for charging.
This paper is organized as follows. First, EV technology is briefly reviewed. The harmonic distortion limit is then highlighted. Harmonic measurement during a single vehicle charging is then presented. Finally, the harmonic distortion during charging of a group of EVs is discussed and commented on.
2. Electric Vehicle Technology
Electric vehicles that will be seen creating issues on the power system grid will be of two types. The first type is plug-in hybrid, where there is a combination of ICE and battery. The second type will be an all-electric vehicle, where this vehicle depends solely on the battery. For both types of EVs, electrical power is needed from the grid for charging.
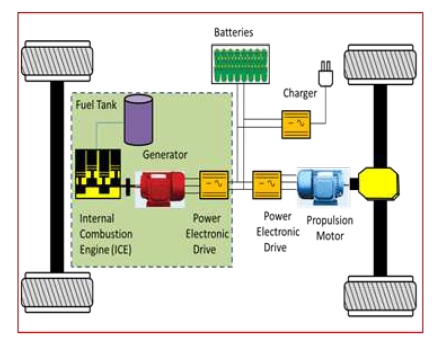
An example of a typical PHEV hardware arrangement is depicted in Figure 1. This is for the parallel type of PHEV. There is also a series type of PHEV, but the focus of this paper is on the grid connection issue, so it is not important if the EV is of parallel or series type. For all-electric vehicles, the components in the light green dash lines are not needed and removed, leaving only batteries, charger, power electronic drive, and propulsion electric motor.
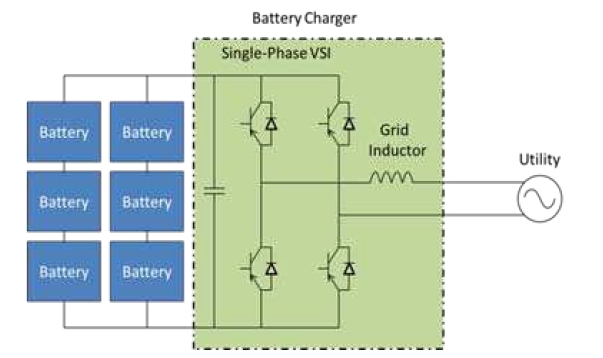
When EV is charging, the only active components are the charger and battery because EV is not moving. For grid interfacing studies, the EV can be represented electrically as depicted in Figure 2. The battery charger is basically a rectifier that converts AC current from the grid to DC current to charge the battery. The rectifier is normally of the active type where the power electronic devices are employed for switching devices. In this diagram, power electronic devices are IGBT.
EV chargers are normally of the conductive type, even though the inductive type is available. Conductive chargers have a direct plug-in connection to the supply, e.g., using an extension power cord to plug from the wall outlet into the EV. Inductive chargers, on the other hand, use magnetic coupling as a mode of energy transfer. Comparing these two types, conductive chargers are simpler to design, have higher efficiency, and are more popular.
3. Harmonics Distortion Limit
Harmonics distortion has detrimental effects on electrical equipment inside the power system. The severity of harmonic is determined by the percentage of total harmonic voltage distortion. Harmonic voltage is referred to as a sinusoidal voltage having a frequency equal to an integer multiple of the fundamental frequency of the 50/60 Hz supply. Total harmonic distortion is calculated as follows [7]:
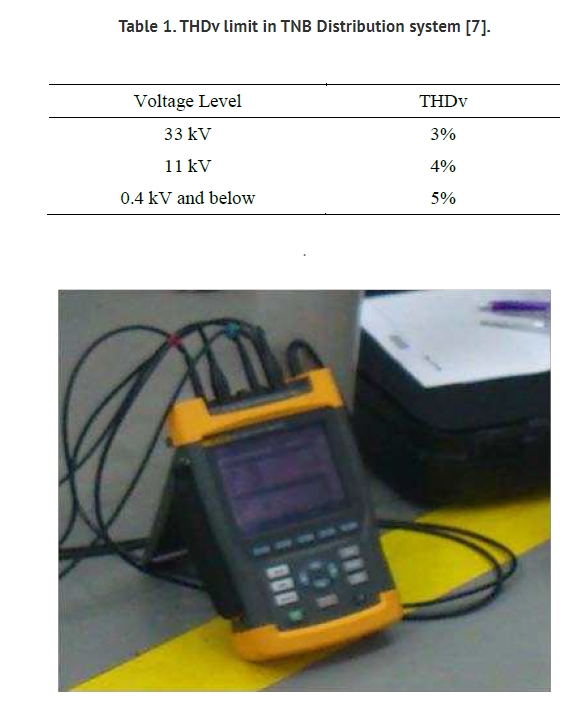
In Malaysia, the main utility company, Tenaga Nasional Berhad, has set a limit on total harmonic voltage distortion according to voltage level as tabulated in Table 1. For current, there is no distortion limit set.
4. Harmonic Measurement
A few field measurement activities were conducted to investigate the harmonic during EV charging. The measurement is performed using a Fluke power quality meter. The picture of the meter is portrayed in Figure 3. The meter has the capability to directly display the voltage and current waveforms in real-time. In addition, the measurement data can be saved into the memory of the meter for further analysis.
For individual harmonic, three types of electric vehicles are compared. The first type of EV is a commercial type of modern EV (EV1). The second type is a modern EV prototype (EV2). The third type is a golf cart. Due to classified and sensitive issues, the names of the manufacturers and the brands of these EVs are not disclosed.
Figure 4 shows the voltage and current waveforms of EV 1. Figures 5 and 6 show THDv and THDi for EV 1 respectively. THDv and THDi after analysis are 1.5% and 11.6% respectively. For EV 2, the voltage and current waveform are depicted in Figure 7. THDv and THDi for EV 2 is 1.2% (Figure 8) and 9.2% (Figure 9) respectively. Figure 10 shows the voltage and current waveform for the golf cart. Figures 11 and 12 show THDv and THDi for the golf cart which are 1.1% and 34.4% respectively.
The measurement results reveal that the THDi from chargers is low for modern EVs but for THDv, modern EVs release higher distortion. The lower THDv from the golf cart can be explained due to the lower current magnitude drawn during the charging. For modern EVs, even though THDi is lower, THDv is higher than measured for the golf cart. This is due to the higher current magnitude drawn by modern EVs.
5. Harmonic From a Group of EVs
In the previous section, THDv measured from a single EV was presented. The value was recorded lower than the limit set by the utility. But the concern on harmonic is when a group of EVs is connected to the grid simultaneously for charging. Many engineers thought that the summation of THD from a group of EVs is linear with the sum of EVs. To find out the answer, a measurement is performed to measure THD from a group of EVs.
In Malaysia, modern EVs are not yet commercialized, so the study cannot be performed on the commercial EVs. But there are many golf carts available which can be used in the study. The results will not represent the modern EV harmonic, but the main objective is to investigate the sum of THD from a single EV and a group of EVs.In the previous section, THDv measured from a single EV was presented. The value was recorded lower than the limit set by the utility. But the concern on harmonic is when a group of EVs is connected to the grid simultaneously for charging. Many engineers thought that the summation of THD from a group of EVs is linear with the sum of EVs. To find out the answer, a measurement is performed to measure THD from a group of EVs.
The measurement was performed at a golf club at Universiti Kebangsaan Malaysia. The measurement was carried out on a working day. On that day, it was raining from early morning until 10:00 am. But the golfing activities were active where all golf carts left the charging point by 9.00 am. The first golf cart returned to the charging station after 11 am. The time, number of vehicles, and the line where they are connected are detailed in Table 2. The measured quantities are voltage and current harmonics distortion. The measurement data was recorded initially every one-hour interval until 6:00 pm. Starting at 7:00 pm, the golf carts started to arrive more often so the measurement was taken every 15 minutes.
The data are visualized through a graph as shown in Figure 14 for THDv and Figure 15 for THDi. Instead of time, the number of vehicles is used for the x-axis to facilitate the pattern of consumption from these EVs. The line where these golf carts are connected were also identified. The consumption starts to increase substantially starting from 6:30 pm (18:30 hrs) when golfers start to return the golf cart to the pick-up point.
The THD is also measured both for voltage and current as shown respectively in Figures 14 and 15. Even though THDv for each single vehicle was measured at 1.1%, at the PCC, the value is only 0.7% for one vehicle. With the increase of vehicles connected, the THDv steadily increases. For eight vehicles on L1, the recorded THDv is only 1.9%.
For THDi of one vehicle, THDi 34.4% is recorded, but at the PCC, THDi is recorded at 47.8%. With the increment of golf cart charging, the THDi value at PCC decreases to 16.6% for 3 vehicles but increases again for 12 vehicles. Surprisingly, THDi does not increase much when the number of vehicles increases from 16 to 22 on L1.
6. Conclusion
In this paper, the harmonic measurement study and analysis during electric vehicle charging is presented. The measurement is performed on golf carts and two modern types of EVs. The measurement result shows that modern EVs release lower THDi compared to a golf cart which is expected. Unfortunately, for THDv, modern EVs cause a higher percentage of distortion. For a group of EV charging, THD for both voltage and current are found not to be the direct summation of the THD from a single vehicle. The results of the study are useful in understanding the harmonic distortion contribution from EVs connected to the grid for charging.
7. Integration of YT Electric's Active Harmonic Filter
To mitigate the harmonic distortion caused by EV charging, YT Electric's Active Harmonic Filter can be effectively integrated into the electrical system. This advanced filter actively monitors and compensates for the harmonic currents in real time, ensuring that the THDi and THDv levels are kept within acceptable limits. By dynamically adjusting to the varying harmonic loads, the active harmonic filter helps maintain power quality and protects the electrical infrastructure from potential damage caused by harmonics.

The integration process involves connecting the active harmonic filter to the point of common coupling (PCC) where the EV chargers are connected. The filter continuously analyzes the harmonic content of the electrical system and injects compensating currents to neutralize the harmonics. This results in a significant reduction in both THDi and THDv, enhancing the overall power quality and reliability of the grid.
In conclusion, incorporating YT Electric's Active Harmonic Filter provides a robust solution to the challenges posed by harmonic distortion during EV charging. It ensures that the electrical grid remains stable and efficient, even with the increasing penetration of electric vehicles.


 IPv6 network supported